Dear Investors,
Bitcoin’s resurgence has sparked a critical question: can its ascent continue before a potential downturn? Historically, bull runs conclude with widespread optimism followed by market corrections. Understanding market dynamics is crucial to avoid becoming exit liquidity for informed investors.
Drawing from experience navigating market cycles, this analysis uses data signals to identify market tops and bottoms. These indicators, previously successful in pinpointing buying opportunities, now suggest a different narrative. The article explores whether Bitcoin can reach $200,000 or if a peak is imminent, analyzing key indicators that have historically signaled major market tops.
We will delve into five key indicators to determine if Bitcoin’s boom is sustainable. These include MVRV Z-Score, Net Unrealized Profit/Loss (NUPL), Pi Cycle Top, Puell Multiple, and the Bitcoin Rainbow Chart. Each indicator provides unique insights into market sentiment and potential turning points.
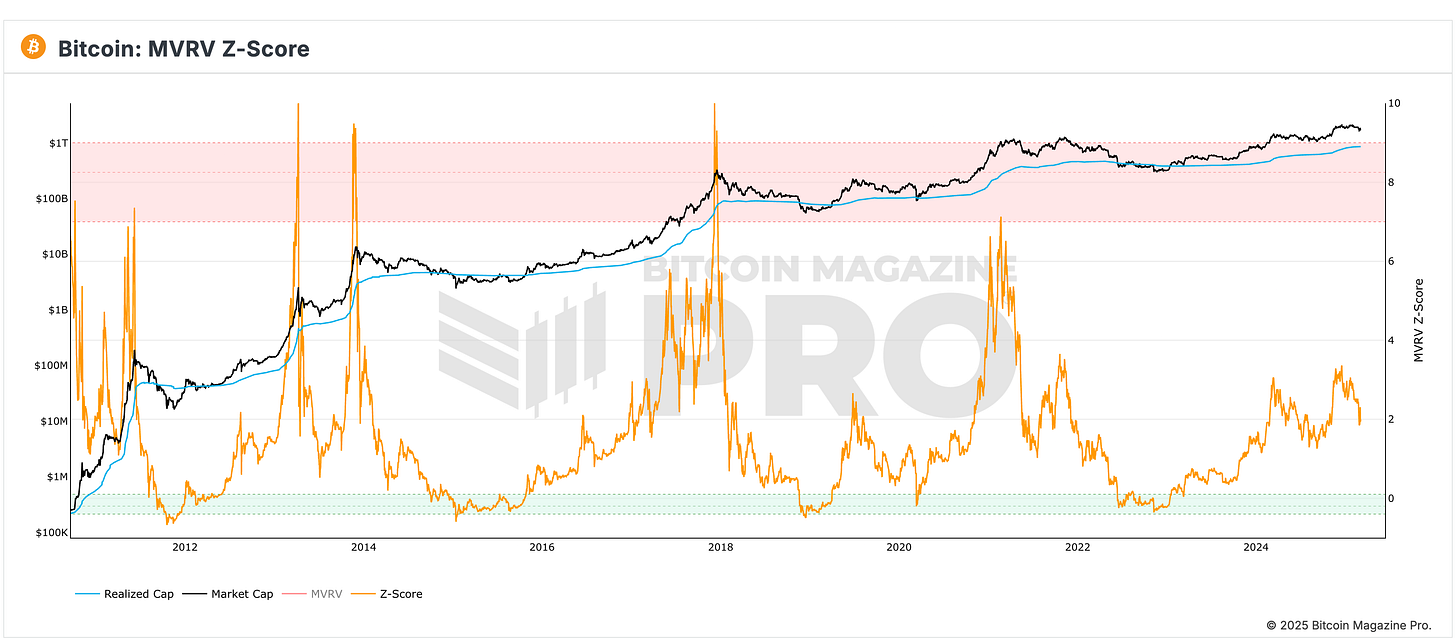
MVRV Z-Score: The Overheat Alarm

The MVRV Z-Score is a reliable metric for assessing Bitcoin’s market condition. It compares market value to realized value, providing insights into fair value by smoothing out market hype. The Z-Score measures the variance between these values. Historically, a Z-Score entering the red zone indicates market mania, typically followed by market peaks within weeks. Conversely, green zones signal undervalued conditions.
Currently, the MVRV Z-Score is trending upwards but remains outside the red zone, suggesting growing optimism without reaching peak euphoria. Monitoring this indicator helps in adjusting buying strategies; nearing the red band prompts a review of other market signals.
Net Unrealized Profit/Loss (NUPL): Investor Greed Gauge
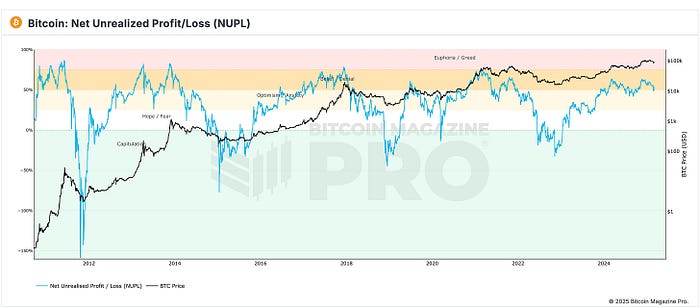
NUPL offers a direct measure of investor sentiment by tracking unrealized profits and losses across all Bitcoin holders. Green zones (below 0%) indicate capitulation, representing buying opportunities amid fearful selling. Yellow to orange zones (25–50%) reflect early bull market hope, while red zones (75%+) signal euphoria, where most investors are in profit and buying interest diminishes.
As of now, NUPL is increasing but remains below the red zone, indicating rising momentum without excessive greed. Investment strategies should align with these phases: aggressive buying in green zones, reduced activity in yellow/orange, and caution in red zones.
Pi Cycle Top: The Moving Average Trick
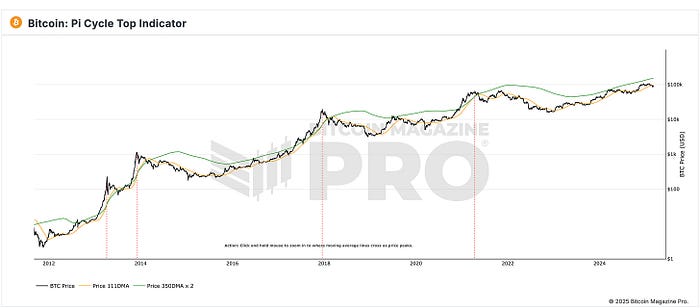
The Pi Cycle Top indicator uses moving averages to identify potential market peaks. It compares the 111-day moving average against the 350-day moving average, doubled. Historically, when the 111-day average crosses above the doubled 350-day average, Bitcoin has reached its top within days.
Currently, the 111-day moving average is climbing but has not yet crossed the 350-day moving average. This suggests continued bull market conditions. If the averages near a cross, it signals a warning to slow down buying and monitor the situation closely.
Puell Multiple: Miner Selling Pressure
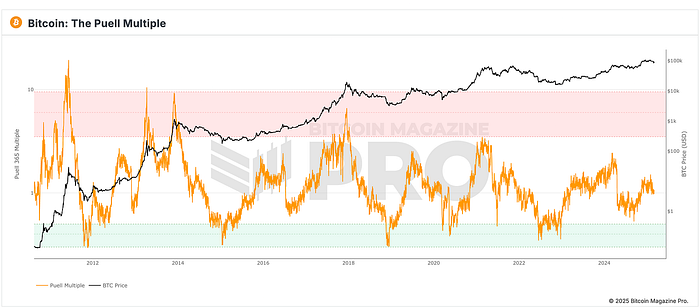
The Puell Multiple assesses miner revenue to gauge potential selling pressure. It divides the daily issuance value of Bitcoin by its 365-day average. Red zones indicate high miner profitability, leading to increased selling and potential market tops. Green zones suggest financial stress for miners, often coinciding with market bottoms.
Presently, the Puell Multiple is rising but not in the red zone, indicating moderate miner profitability without excessive selling pressure. A push into the red could signal increased selling that might cool the market rally.
Bitcoin Rainbow Chart: The Meme That Works

The Bitcoin Rainbow Chart is a logarithmic growth curve mapping Bitcoin’s market cycles. Blue and green bands represent accumulation zones, yellow and orange signify mid-cycle growth, and red indicates bubble territory where profit-taking is advisable. Historically, Bitcoin peaks when it reaches or exceeds the red band.
Currently, Bitcoin is in the upper-middle bands, suggesting a strong bull market without reaching euphoric bubble conditions. The red zone remains a danger area, but the market is not yet close to this level.
This Cycle is Different: How to Play It?
Unlike previous retail-driven bull runs, current market dynamics feature significant institutional investment. Entities like MicroStrategy, BlackRock’s ETF, and mining operations are absorbing supply, potentially leading to a slower, more extended market peak rather than a sharp crash.
Investors can leverage these indicators to gain an edge. A comprehensive approach using multiple indicators helps avoid premature selling or prolonged holding. A strategic playbook includes aggressive buying during normal ranges, cautious monitoring when one or two indicators heat up, and gradual selling when multiple indicators flash red.
Key strategies include understanding that timing the market precisely is difficult and that wealth is tied to ownership.
The Pareto Permanent Portfolio
The Pareto Pure Alpha Portfolio aims to maximize returns using the 80/20 rule, enhancing investment efficiency. Focusing on high-impact ETFs, it includes IBIT (Bitcoin ETF), OEF (U.S. equity growth), and IAU (Gold ETF), balancing risk-adjusted returns.
As of March 5, 2025, the portfolio’s performance reflects a 0.4% year-to-date decrease, influenced by IBIT’s -8.92% drop and OEF’s -2.59% decline, offset by IAU’s +9.89% gain. This diversification helps mitigate volatility, with gold acting as a stabilizer amid crypto and equity market fluctuations.
Conclusion
Analyzing Bitcoin’s potential boom requires a multifaceted approach, integrating technical indicators with an understanding of market dynamics. The MVRV Z-Score, NUPL, Pi Cycle Top, Puell Multiple, and Bitcoin Rainbow Chart provide valuable insights into market sentiment and potential turning points.
By monitoring these indicators and adjusting investment strategies accordingly, investors can navigate the Bitcoin market more effectively. Remember that while institutional involvement may extend the market cycle, vigilance and data-driven decision-making remain crucial for maximizing returns and minimizing risks. Staying informed and adaptable is key to succeeding in the ever-evolving world of cryptocurrency investment.
Leave a Reply