Real estate has long been considered a safe and profitable investment. However, prevailing wisdom isn’t always correct. This article explores why I choose not to invest in real estate, challenging the conventional belief that it’s a guaranteed win. Factors that have historically driven up housing prices are beginning to wane or even reverse, potentially leading to a future where real estate values decline.
To understand this perspective, we’ll delve into the fundamental principle of supply and demand. By examining historical trends and current shifts, we can gain valuable insights into the future of the housing market. This analysis primarily focuses on developed economies.
Have Housing Prices Always Gone Up?
No, despite the common perception.
Most people’s living memory only extends back to the 1950s, a period during which real housing prices quadrupled. However, a longer-term historical view reveals a different picture:
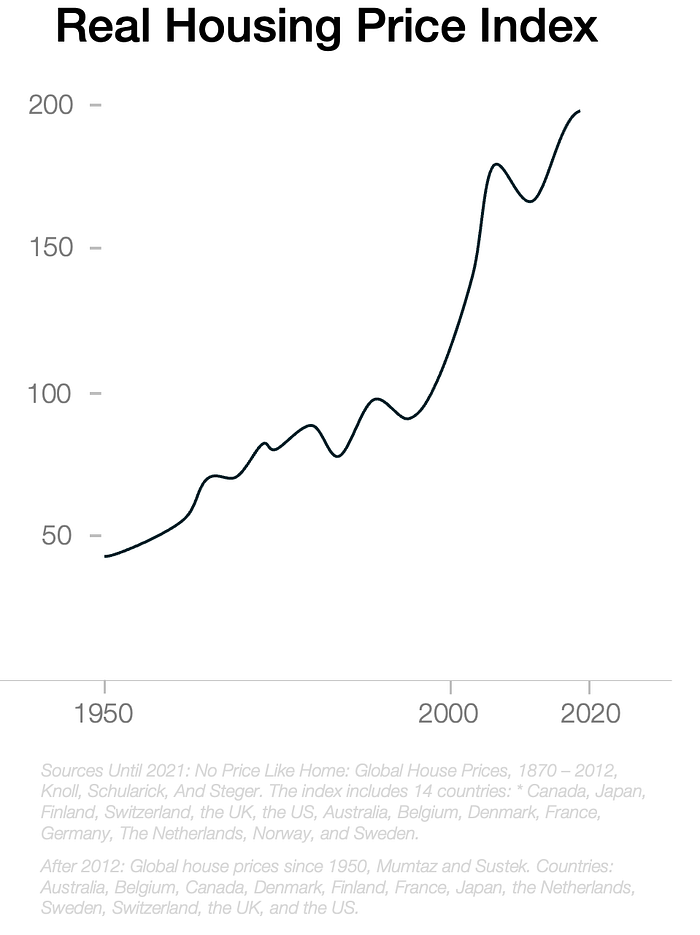
Significant price growth began only after 1950. Examining data from Amsterdam and Belgian cities further illustrates this point:

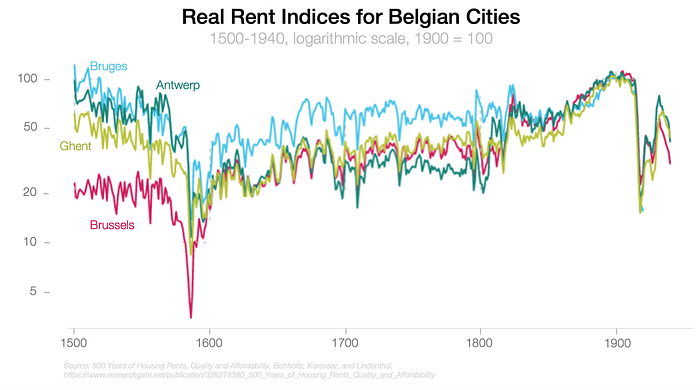
Historically, housing prices were remarkably stable. The dramatic growth we’ve witnessed recently stems from demand exceeding supply.
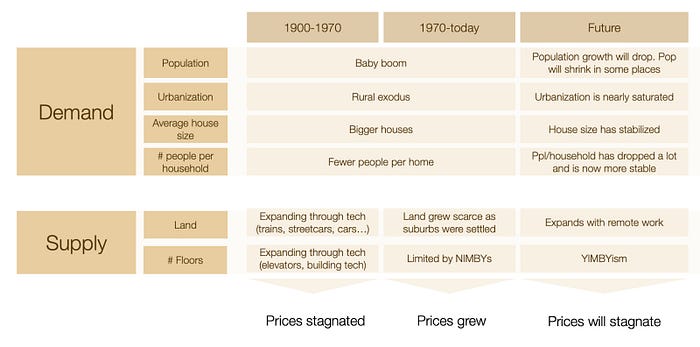
Demand
Several factors drive the demand for housing:
- Population growth
- Increased urbanization (people wanting to live in cities)
- Desire for larger houses
- Trend toward smaller household sizes
These trends have significantly increased over the past few decades. However, their continued growth is unlikely, and some may even reverse.
1. Population Growth
A larger population naturally requires more housing.
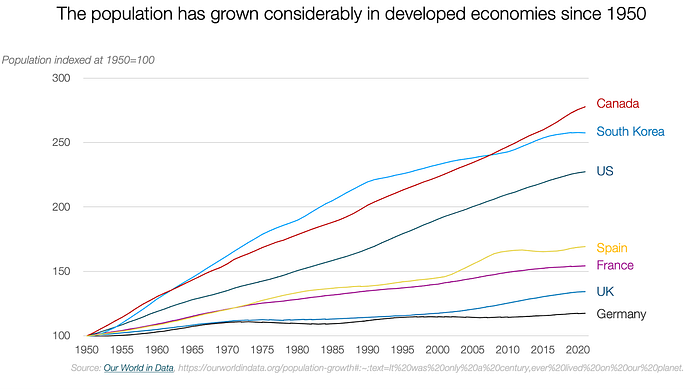
Population growth has been exponential, particularly in recent times. However, this trend is nearing its end.
Japan, China, and Europe are already experiencing population decline. While the US still sees growth due to immigration, its growth rate is projected to decrease. This trend is mirrored globally.
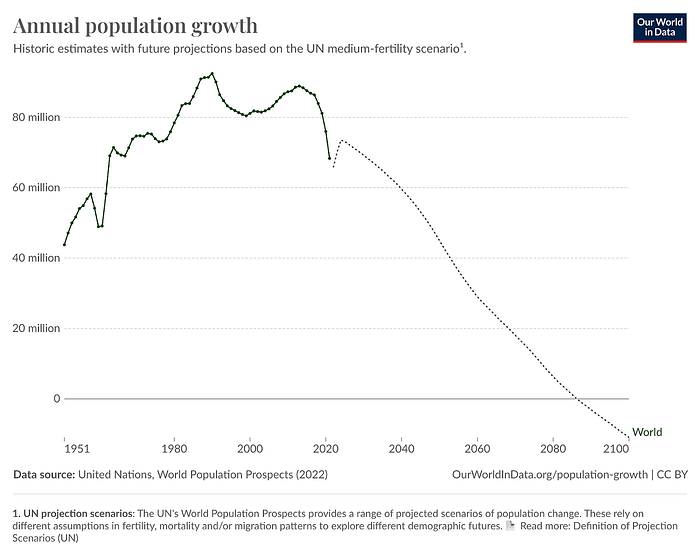
Declining fertility rates worldwide drive this demographic shift. Fertility rates are already below replacement levels in most countries and are expected to continue falling.

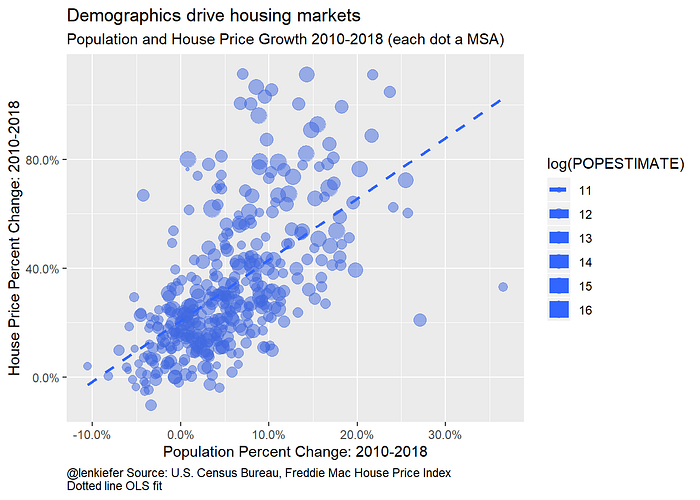
More people translate to higher housing prices, as evidenced by the following graph for the US:
2. Urbanization
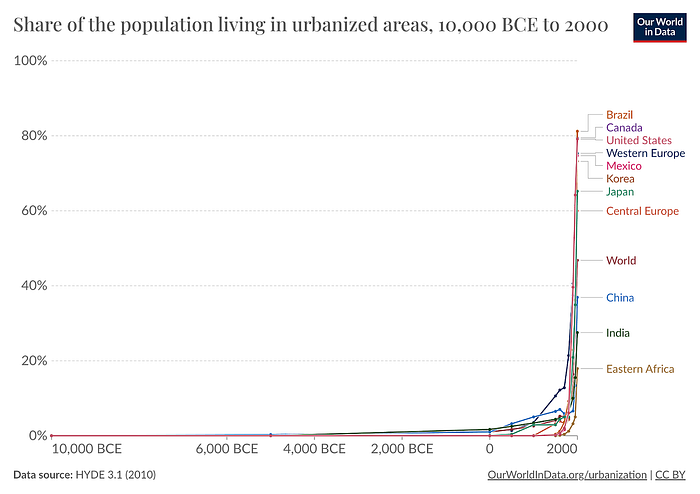
The increasing desire to live in cities is a relatively recent phenomenon. In the mid-1800s, less than 20% of the population in nearly all countries was urban.
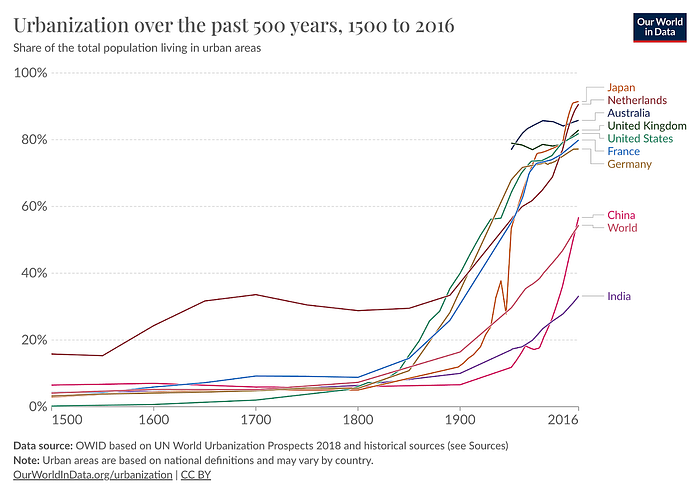
As urbanization increased, demand for urban housing rose, driving up prices. Denser areas correlate with higher prices.
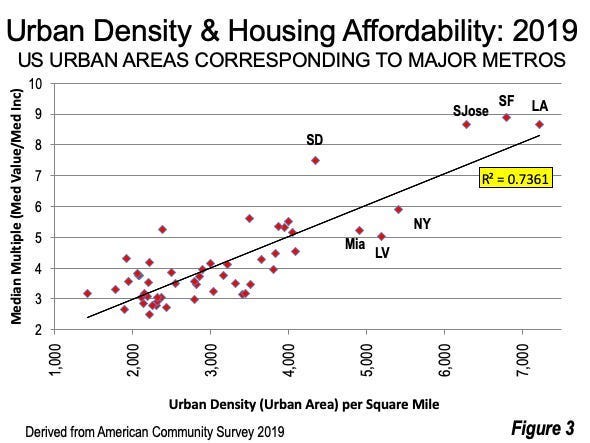
However, urbanization rates cannot continue increasing indefinitely. The substantial increase from 10% to 90% urbanization is unlikely to be repeated. This key driver of demand for urban land is now diminishing, particularly with the rise of remote work.
3. Household Size
The average number of people per household has significantly decreased over the past two centuries:
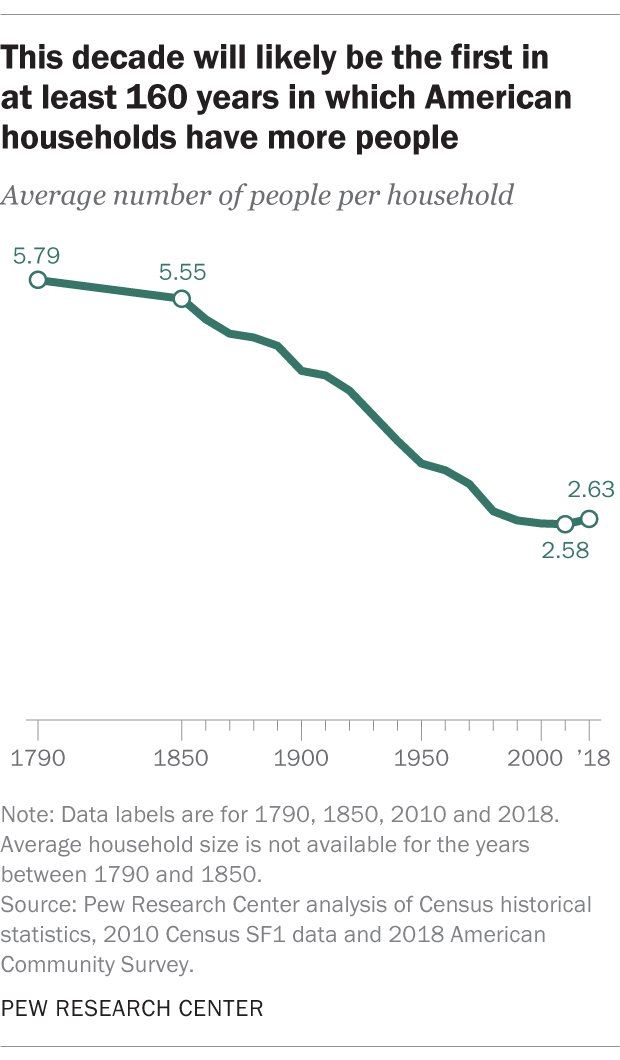
However, this trend has plateaued or even reversed in recent years. The demand for more homes due to smaller household sizes grew until the 1990s but has since stagnated.
The same holds true in Europe, where household sizes are even smaller:
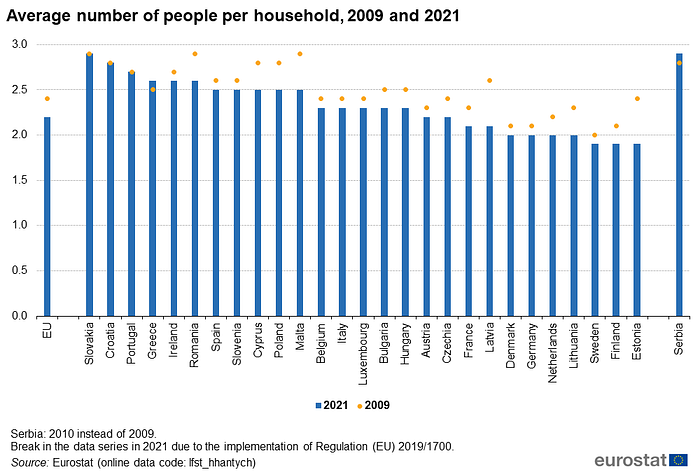
This trend’s primary driver is family size, which is now approaching its limit:
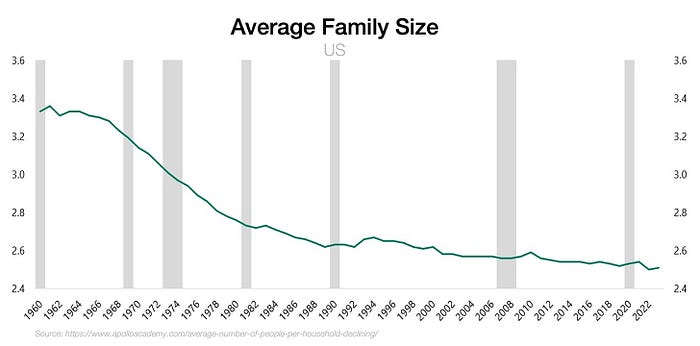
4. Bigger Houses
While family sizes shrank, house sizes increased:
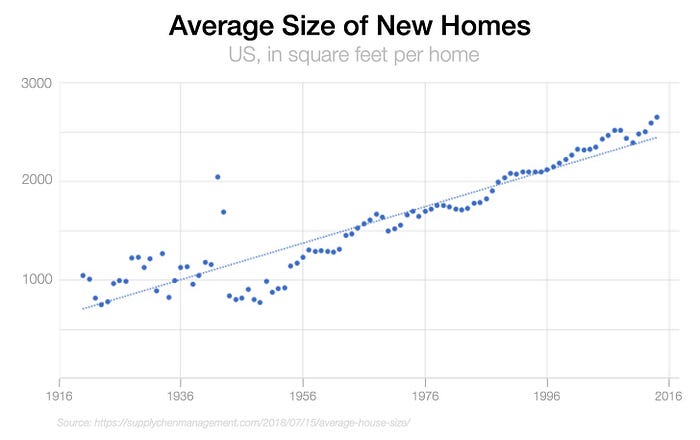
This has led to houses with one room per child, a stark contrast to the past when multiple people shared a single room.

This trend is also apparent in other wealthy countries.
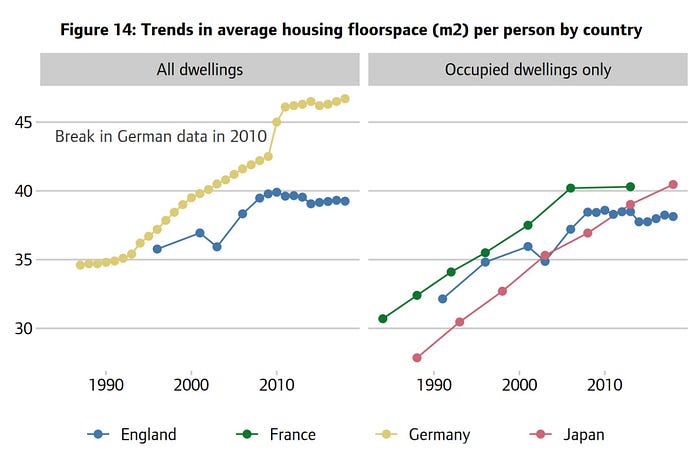
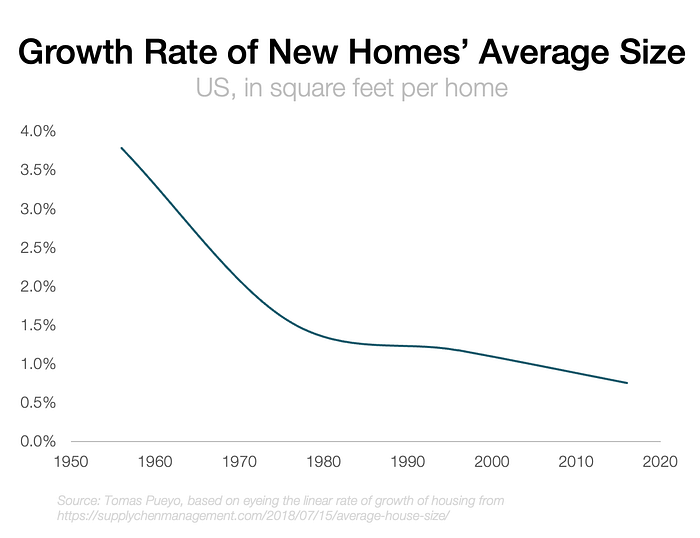
However, the value of each additional square foot diminishes as houses grow larger. Eventually, people reach a point where they have enough space and no longer desire more empty rooms. This trend will eventually cease or, at least, decelerate.
In summary, the last few decades have seen:
- Increased population
- Greater urbanization
- More people living alone
- Larger houses
These trends significantly increased demand for housing since 1950. However, these trends are now slowing or reversing.
Supply
Houses occupy physical space, limiting supply growth to horizontal or vertical expansion.
1. Horizontal Supply and the Marchetti Constant
Transportation technology is a primary driver of city size. People are generally unwilling to commute for more than 30 minutes—the Marchetti Constant. Improved transportation technologies increase commute speeds, expanding city footprints.
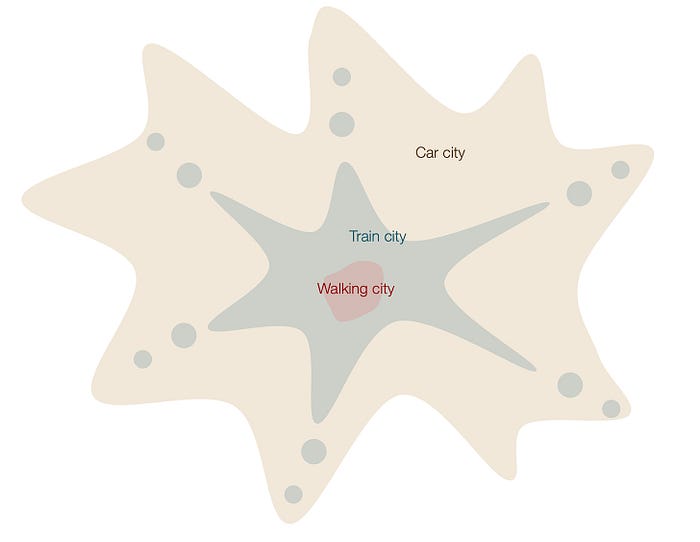
Historically, city size was limited. The advent of trains, streetcars, bicycles, and cars increased commute speeds.
A tenfold increase in commute speed allows people to travel ten times farther in 30 minutes, expanding the city’s edge tenfold.
The available land increases by the square of that, making the city 100x bigger!
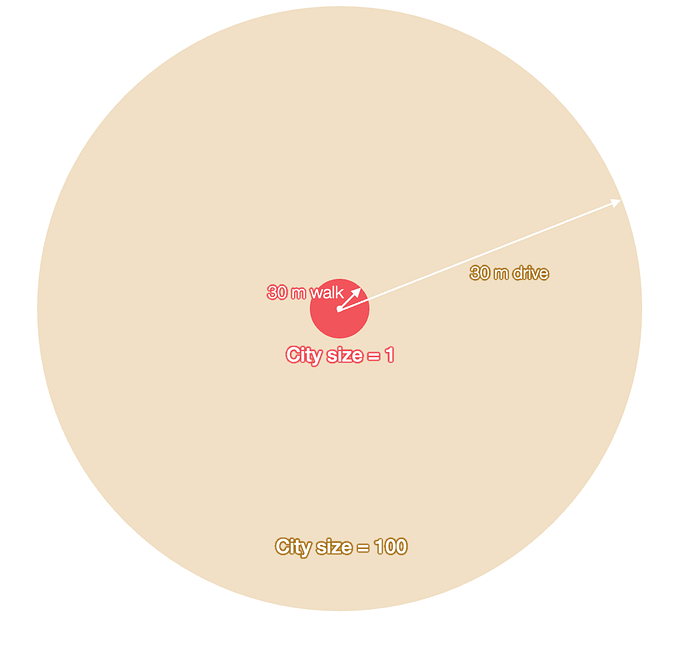
Cars increased the supply of land for housing by 10-100x compared to walking.
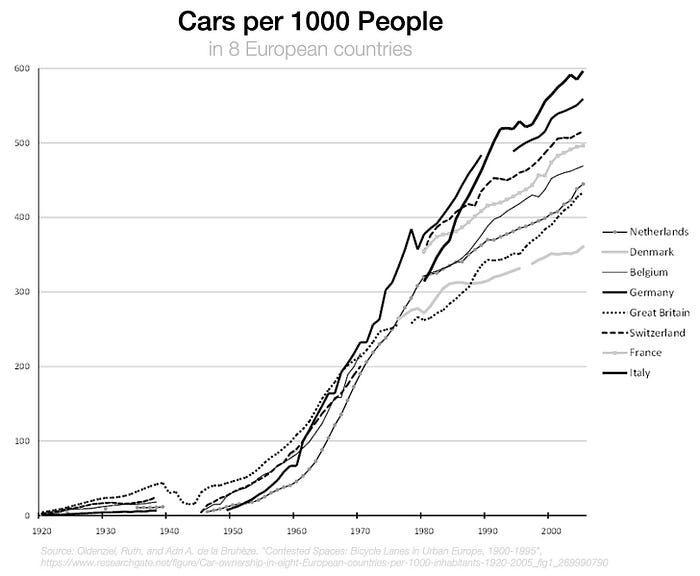
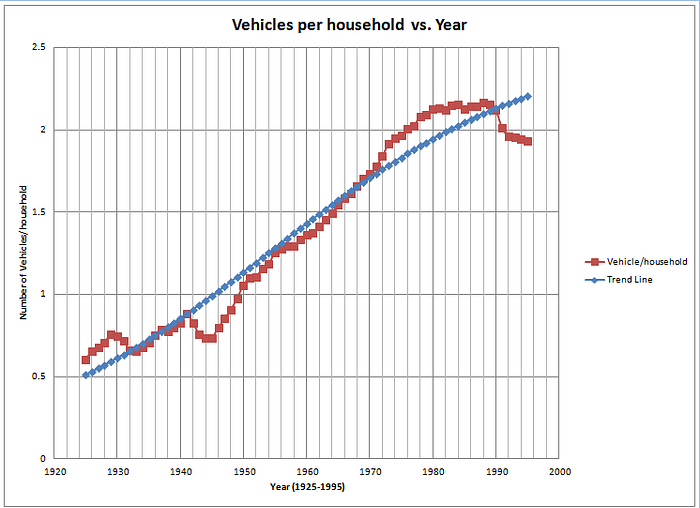
However, this is contingent on car ownership, which has increased dramatically but is now reaching saturation.
In the US, there are approximately two cars per household, a number that hasn’t grown since the late 1980s.
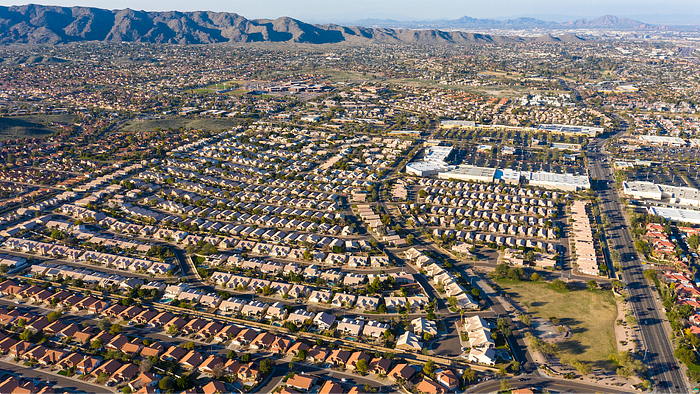
As car ownership plateaus, cities have stopped growing horizontally. Suburban expansion, prominent from the 1950s to the 2000s, has slowed as new suburbs become increasingly distant from city centers. This limited housing supply, driving up prices.
However, remote work is changing this dynamic by eliminating commute times.
Remote Work
If cars allow people to live dozens of kilometers from downtown by traveling at 30–50 km/h, what happens when they can travel at 300,000 km per second? When you work remotely, you are no longer limited by the Marchetti constant. At most, you’re limited by the timezone.
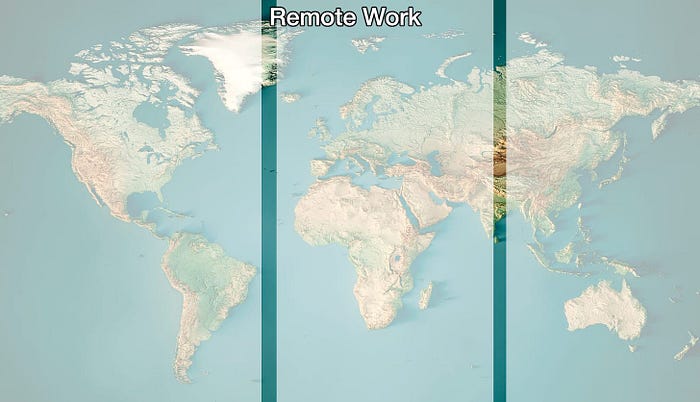
People couldn’t work remotely until very recently. Now, they can get electricity and Internet from virtually anywhere:

Many people will choose to live in rural and semi-urban areas, where prices are lower and the quality of life is higher. The entire world is now potential housing supply. This increased supply is likely to decrease housing prices in the long run.
2. Vertical Supply and Sky Highways
Construction and elevators have increased the supply vertically.
Until the 1800s, buildings were at most six floors tall because taller ones would crumble under their own weight. But steel framing and reinforced concrete changed that, technically allowing buildings to grow taller.
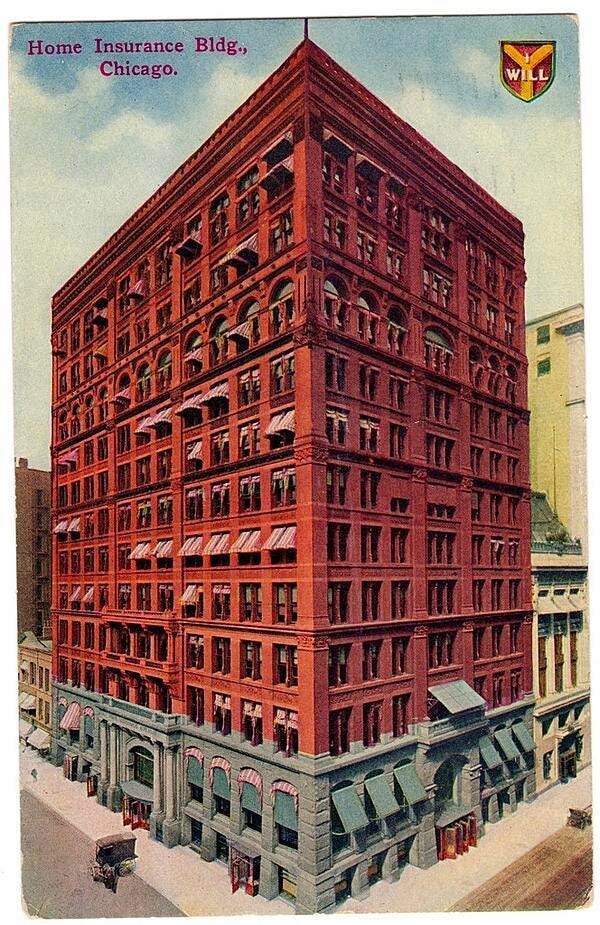
In the past, higher floors were for poor people because nobody wanted to climb six flights of stairs.
The elevator, invented at the end of the 1900s, changed that. It allowed people to reach any floor easily. Coupled with the advent of electricity and things like water pumps for water access in high floors, elevators didn’t just make higher floors possible; they made them better. Now you’d rather have the penthouse than the ground floor. This is only 100 years old.
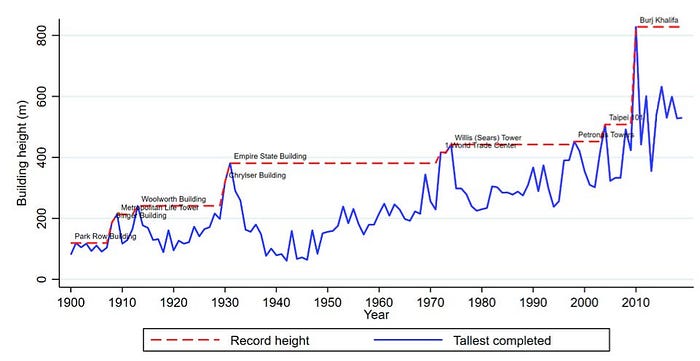
As skyscrapers filled the skyline, people’s dwellings ascended into the heights, and this new supply kept prices controlled in the first half of the 20th century.
Then, we stopped building up.
NIMBYism
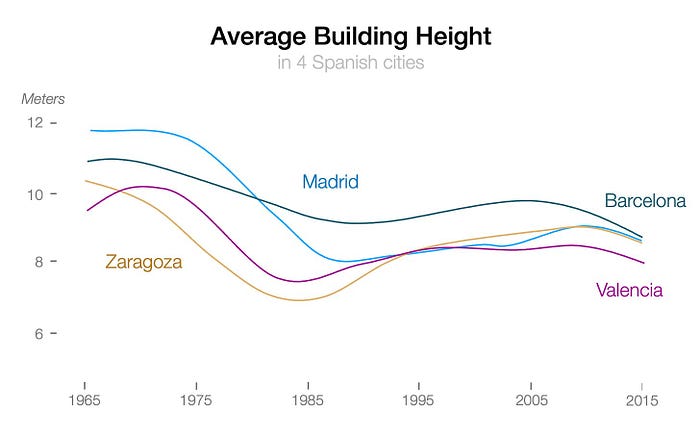
There are height restriction laws for buildings in most cities in Europe and North America. These have prevented buildings from growing up, limiting the supply of housing, and driving prices up.
Building restrictions are also likely to be relaxed for another reason: As demand shrinks, prices will drop, cities will compete to attract more people, and building restrictions are likely going to be relaxed.

Conclusion
Historically, population and urbanization growth drove housing prices. However, these trends are now slowing or reversing. Combined with the rise of remote work and potential easing of building restrictions, the housing market may be entering a new era.
We’re moving from a world where people have only experienced growing housing prices, to one where they are likely to shrink.
This shift raises questions about the future of real estate as an investment. Given these factors, I choose not to invest in real estate.
There are, of course, additional factors to consider. However, the fundamental trends suggest a less optimistic outlook for real estate investments compared to the past.
Leave a Reply