
It doesn’t matter whether you have a scientific background or not, if you are asked to name some of the smartest people from the previous century, the name of Einstein will come to your mind. However, in my opinion there is another genius who can be put on the same level as Einstein for his achievements, and in fact, his theories are much more relevant for us traders and for any other kind of people doing forecasting.
His name is Claude Shannon and he was a mathematician, electrical engineer, computer scientist and cryptographer, mostly known as the “father of information theory” which made possible the existence of the internet, but what many people don’t know is that he was also an extremely successful investor who dedicated his brilliant mind to learn about forecasting stocks during most of his adult life.
They don’t realize that we have people of the calibre of Shannon who was hands down smarter than 99.99% of current traders and who, for obvious reasons, is not interested in selling you anything. Don’t we think it is better to follow the ideas of such a person?
Well, in this article I hope to convince all of you that it is indeed essential to study Shannon ideas, and I will try to give you the most important insights.
But, what does information theory have to do with trading? Well, everything. Shannon’s insights extend far beyond their original context and have deep implications for financial markets, risk management, and trading strategies.
So, to understand the importance of Shannon lessons I have to start by looking at the main questions that many quants want to solve went they start coding strategies.
The Most Common Flaw in the Mindset of Beginner Quants
The beginner quant these days finds herself surrounded by an enormous amount of information. Probably she already knows how to code in Python and has experience in fields like data science, machine learning or artificial intelligence. She is probably familiar with many forecasting algorithms.
And so, naturally she often asks herself questions like what is the best model she can use to predict the stock prices? Should she use a LSTM or maybe Reinforcement Learning? What language and library will allow her to create such a cool and efficient algorithm? Maybe she should use XGBoost or perhaps go for Deep Learning with Tensorflow or Pytorch?
If you need to forecast something that can be forecasted, then you can be sure that any decent forecasting model will do a nice job.
And here is where Shannon comes to the rescue with the important questions you need to make yourself.
These questions are of this type:
- What am I trying to predict? Is it the price of a stock next year, next month or next minute?
- How predictable is the target at which you are aiming?
- Is it really possible to predict it at all?
- And if so, basing on how well you predict it, how much money should I risk in a given bet?
These are much more important questions, because before making any predictions, we should be aware of the nature of the variables that we are trying to predict, and that is exactly why Shannon theories can measure.
Shannon’s Entropy: Measuring Uncertainty
The most important idea for traders in all of Shannon’s work is hands down the concept of entropy, a measure of uncertainty or randomness in a system.
In the context of information theory, entropy quantifies the amount of unpredictability or information content. High entropy means high uncertainty — a message or system with more possible outcomes or states. Conversely, low entropy signifies more predictability.
In trading, understanding and measuring uncertainty is crucial. Markets are inherently uncertain, influenced by countless variables and human behaviors. Shannon’s concept of entropy can help traders quantify this uncertainty, giving them a mathematical framework to assess the level of risk they are taking on with each trade.
For example, consider the financial markets as a communication system, where price movements are the messages being transmitted. Shannon’s entropy allows us to measure the unpredictability of these price movements. By doing so, traders can better understand the risk associated with different assets, time frames, and market conditions.
But let’s get hands on and understand this in practice.
What Traders Losing Money Don’t Understand
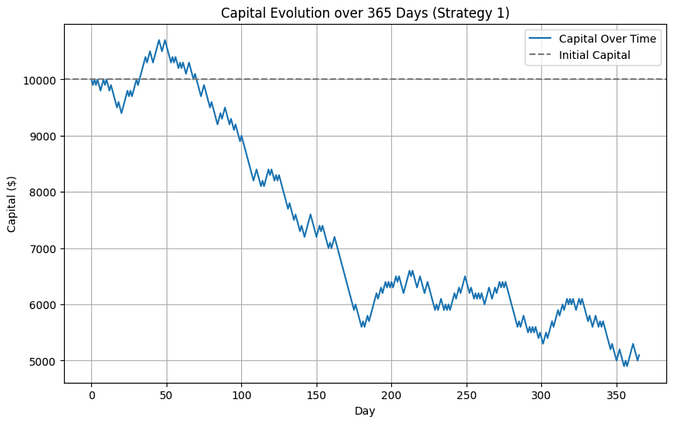
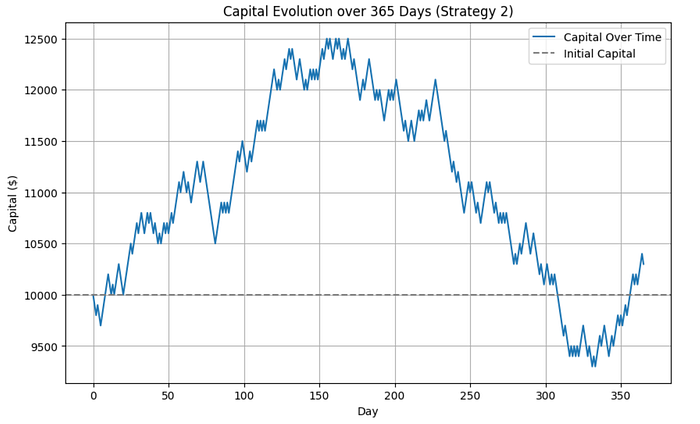
Let me show you the plots of how some day trading strategies performed over 365 days of trading, they are all starting with initial capital of 10000$ and risking 1% of the capital (100$) in every trade.
Just have a look at the strategies and tell me which one you think works the best.
Strategy 1: Returns a loss of almost 50%
Strategy 2: Final capital remains almost the same as initial
Strategy 3: Returns a profit around 30% after one year
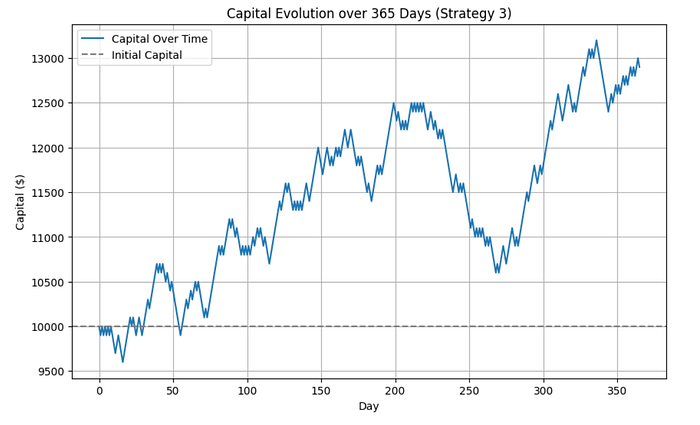
Well, if like most people you like your strategies to generate profits then you probably chose Strategy number 3 because it generated the most profit.
Now there is one problem, these 3 strategies are exactly the same, they are completely random strategies, so the probability of winning every trade was 50%, exactly the same as losing.
Now, after seeing this, you need to realize that this is exactly what you see when you look at the graph of your strategies when you backtest trading algorithms. You try to forecast the probability of a stock going up or down with your fancy algorithm of choice in a given time frame, then you bet accordingly.
Then you go to your backtesting tool and run a backtest to see how often you were right or wrong. Let’s assume that your strategy was profitable with a return of +30% over the period of the test. Now, does it mean we are ready to celebrate?
Well, as actually no, because as you saw in the graphs above it could be just luck, a random variable can actually give you nice results. So, how do you know that your strategy is actually likely to be right more often than wrong?
Well, Shannon can tell you. The concept of entropy of Shannon measures just this. The example above was the worst case possible, a totally random variable with the probability of losing being equal to probability of winning at 50%. On the contrary, if your target variable has a low entropy then it will be easier to predict and you can be more certain to be right more often than wrong.
What Is Your Job As a Quant?
So, to reply our initial questions: what should I be trying to predict? Well, at this point, I hope it is clear that your task as a quant is not to code a fancy model.
Your task as a quant is to investigate, research and play with data until you find (or construct yourself) a variable with a low entropy that is easy to predict. Then you can use whatever algorithm you like and the graph of the backtest should have low variance. At that point, you are ready to go live and put money on your strategy.
Now, in the next article we will get hands on and I will continue expanding this concept and explain with examples how you can measure randomness, find the right variables to predict and make sure that your model is ready to make money.
Quantitative Trading Strategies
Thanks for reading until the end. Before you go:
- Visit this Site: https://buymeacoffee.com/diegoruiz/e/308543 to get interact with me, get access to the outputs of my own quantitative trading model or just support my work with a tip.
- Visit my Youtube Channel: https://www.youtube.com/@ModernaiTrading
Leave a Reply