Implied Volatility (IV) is a key indicator of market sentiment, reflecting expectations for future price movements. Analyzing IV provides insights into potential market swings, impacting options pricing and trading strategies. By understanding how to automate IV analysis, investors can make more informed decisions and manage risk effectively.
This article details how to perform Implied Volatility Analysis using Python. We will explore the automation of gathering options data, plotting volatility smiles, and interpreting critical metrics such as open interest and the Greeks. Python code snippets and step-by-step instructions are provided in Google Colab. A user-friendly tool is also available for non-coders to perform a similar analysis. This comprehensive guide is designed to empower both novice and experienced traders.
Here’s what we will cover:
- Key IV & Options Concepts
- Gathering Options Data
- Volatility Smile Analysis
- Open Interest Analysis
- Volume in Option Prices
- Volatility Surface Plot
- Historical IV Analysis
- Sentiment Analysis
Implied Volatility as a Tool
Implied Volatility (IV) measures the market’s expectation of future price changes, differing from historical volatility, which looks at past price behavior. IV is crucial for gauging market sentiment and pricing options, where high IV indicates expected large price swings and increased option premiums, while low IV suggests calmer prices and cheaper premiums.
The Black–Scholes model underlies IV, with option prices dependent on volatility (σ). Implied Volatility is the σ that aligns the model’s theoretical price with the actual market price. Since there is no direct formula for IV, iterative methods are used to find σ, adjusting it until the model price matches the observed price.
Market Sentiment
IV reflects the market’s mood, closely watched during significant events like corporate earnings. A rise in an asset’s IV before earnings suggests expectations of substantial price changes, influencing trading strategies.
Option Pricing
IV directly impacts option premiums; for instance, option prices increase when a stock’s IV rises due to a major product release. Sellers may benefit from elevated premiums in such scenarios, while buyers may find low IV environments favorable, anticipating future volatility spikes.
Volatility Smiles and Surfaces
Volatility smiles illustrate how IV varies with strike prices, often showing a U-shaped curve where deep in-the-money and far out-of-the-money options have higher IV. This contrasts with the Black-Scholes model, which assumes constant volatility across all strike prices. The U-shape becomes more pronounced in turbulent markets.
Open Interest and Volume Analysis
Monitoring open interest and volume alongside IV reveals trader positioning. Rising open interest in calls with higher IV can signal bullish sentiment, prompting traders to buy calls or the underlying stock. Understanding these dynamics helps in anticipating market movements.
The Greeks
The Greeks are vital for quantifying an option’s sensitivities to various factors:
- Delta shows how much the option moves when the stock moves. If a call has a 0.6 delta, it gains $0.60 when the stock goes up $1.
- Gamma tells you how fast delta changes. A high gamma means delta jumps around more, making gains or losses happen quicker. If gamma is 0.05, delta might go from 0.6 to 0.65 when the stock moves $1.
- Theta measures time decay. If theta is -0.10, the option loses $0.10 every day, even if nothing else changes. Short-term options lose value faster.
- Vega shows how much the option moves when implied volatility changes. If vega is 0.20, the price jumps $0.20 for every 1% rise in IV. This matters most before events like earnings.
Historical IV Comparison
Comparing current IV to historical levels indicates whether options are expensive or cheap. If IV is significantly above its usual range, the market might be overreacting, presenting opportunities to sell options at high premiums. Conversely, low IV might suggest underpriced options, making them attractive for purchase if volatility is expected to rise.
Gathering Options Data
To gather options data, we’ll use yfinance to get the latest options data and pandas to organize it. The data will show only the most recent options available, not historical data.
For this example, we’ll use ASML. The retrieved data includes:
- contractSymbol — Unique ID for the option.
- lastTradeDate — Date and time of the last trade.
- strike — Strike price of the option.
- lastPrice — Most recent traded price.
- bid — Current bid price.
- ask — Current ask price.
- change — Price change from the previous close.
- percentChange — Percentage change from the previous close.
- volume — Contracts traded during the last session.
- openInterest — Total number of open contracts.
- impliedVolatility — Implied volatility of the option.
- inTheMoney — Shows if the option is in the money.
- expiration — Expiration date of the contract.
- type — Call or put option.
Why a Volatility Smile
The volatility smile is a graphical representation of how implied volatility (IV) varies across different strike prices for options with the same expiration date. It typically shows a U-shaped curve, indicating that options further away from the current market price (either deep in-the-money or far out-of-the-money) have higher implied volatilities compared to those closer to the current price.
- Market Risks and Events: Large anticipated moves, like news events, can push up the demand for far out-of-the-money options.
- Demand and Supply: Many traders use out-of-the-money options for hedging or speculation, which can bid up their implied volatility.
- Leverage and Hedging: Institutions might favor deep in-the-money options for hedging big positions, raising IV there as well.
The result is a “smile” or sometimes a skew if one side (calls or puts) sees higher demand.
The function below plots the Volatility Smile for Puts and Calls, i.e. strike price vs IV.
Different expiration dates are factored into the plot as well. The expiration date affects the shape of the volatility smile.
- Short-term options have a more pronounced smile. Deep ITM and far OTM options show higher IV due to speculation, gamma hedging, and event risks.
- Long-term options have a flatter smile. IV is more stable across strikes since long-term uncertainty is priced in gradually.
- Events matter. Earnings and major news cause short-term IV spikes, making the smile steeper.
Open Interest Analysis
Open interest reflects the total number of outstanding option contracts that are currently active. It represents the aggregate number of contracts that have been opened but not yet closed or exercised. Analyzing open interest alongside implied volatility offers insights into market liquidity and potential price movements. A surge in open interest can indicate that traders are anticipating significant price changes.
For example, if open interest spikes and IV rises, traders could be positioning for an upcoming event.
If open interest rises but IV stays low, it could mean traders are selling options to collect premium rather than expecting big moves.
Volume in Option Prices
Volume represents the number of option contracts that have been traded during a specified period. Analyzing volume trends can provide valuable insights into market sentiment and the potential direction of underlying assets. High volume on certain strikes can point to strong opinions about the underlying’s near-term direction.
When combined with rising implied volatility, high call volume might imply bullish sentiment. High put volume plus rising IV might point to bearish sentiment.
Open interest adds another layer. If volume is high but open interest stays flat, traders might be closing positions. If both rise together, it suggests new money entering the market.
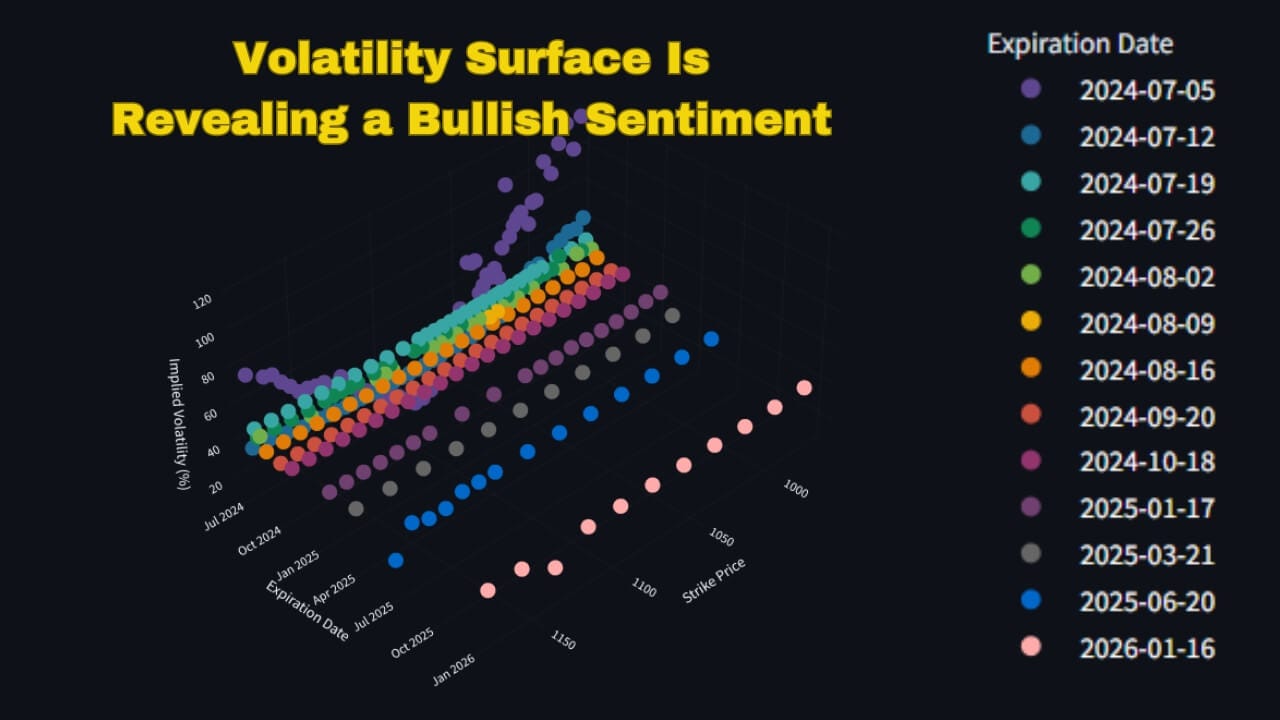
Volatility Surface Plot
A volatility surface is a 3D plot that illustrates how implied volatility (IV) changes across different strike prices and expiration dates. It helps traders visualize market expectations of future volatility for various option contracts.
Puts Volatility Surface
Higher IV at certain strikes or expirations can mean traders see more risk there. Short-term options have higher IV before big events like earnings. Longer-term options usually have a smoother IV curve since the market expects prices to even out over time.
Calls Volatility Surface
We can plot the same 3D graph for call options. Some stocks show similar patterns for calls and puts, while others have clear differences.
A strong bullish or bearish bias can make those differences more noticeable. Comparing both surfaces gives a better read on sentiment.
Historical IV Comparison
Comparing current implied volatility (IV) to its historical values helps determine whether options are relatively expensive or cheap. By tracking IV over time, traders can assess market sentiment and identify potential opportunities.
We can approximate implied volatility historically by comparing the range of daily high and low prices. The formula is:
This is a rough proxy but can help track the relative volatility environment over time. If the latest reading is much lower than past peaks, the stock might be stable. If it’s climbing, it could indicate emerging unease.
Put-Call Ratio Calculation
The Put-Call ratio shows market sentiment by comparing put and call volume. The formula is:
- Above 1: More puts than calls — bearish sentiment.
- Below 1: More calls than puts — bullish sentiment.
- Around 1: A balanced market outlook.
Implied volatility adds more context. A high ratio with rising put IV can mean traders are preparing for a drop. A low ratio with rising call IV can point to strong bullish bets.
Greeks Analysis
Use Greeks, IV, and probabilities to fine-tune entries and risk management.
- Delta + IV: A 0.30 delta call might have a 30% chance of expiring ITM, but if IV is high, the expected move could push the stock past the strike. If IV is low, the move may not happen.
- Gamma + Short-Term Trades: A weekly option with high gamma can see delta shift fast which makes it riskier for holding overnight. Hedging might be needed if price swings are large.
- Theta + IV: If IV is high, selling options with high theta (like short-term calls or puts) can work since time decay is faster. If IV is low, long options hold value better.
- Vega + IV Expansion Trades: If a stock is at historically low IV, buying long-dated options with high vega can benefit if IV rises. If IV is already high, shorting premium might be a better play.
Always check how Greeks and IV interact before taking a trade. It helps align probabilities with actual risk.
Sentiment Score
One could calculate a more formal sentiment score using the following formula:
A positive score hints at a bullish mood. A negative score implies a bearish tone. This calculation tries to capture two dimensions. First, it checks the gap in implied volatility. Then it factors in how many more calls or puts are trading.
Concluding Thoughts
Bringing it all together — IV, open interest, volume, Greeks, and past trends — gives a clearer market view. You can see sentiment, see if traders lean bullish or bearish, see reaction factors and adjust trades accordingly. Combining these metrics offers a holistic view of market dynamics, helping traders gauge sentiment and refine their strategies based on whether the market leans bullish or bearish.
Understanding how these factors interact allows for more nuanced trade adjustments, aligning investment decisions with prevailing market conditions. This comprehensive approach provides investors with a robust framework for navigating the complexities of the options market.
Thank you for taking the time to read. If you found the article insightful, please consider clapping to support future content.👏
For a a range of other innovative, data-driven tools in Financial Data Science, we encourage traders and investors to explore the resources available at www.entreprenerdly.com.
Leave a Reply